knitr::opts_chunk$set(
echo = TRUE,
message = FALSE,
warning = FALSE
)

library(readxl)
library(tidyverse)
library (ggplot2)
library(ggthemes)
library(pheatmap)7 Streaming Service Analytics
7.1 Introduction
In this assignment, I worked as a data analyst for the Streaming Analytics Division. I was tasked with discovering whether age group impacted individuals’ streaming platform preferences.
7.2 Data Preparation
tvdata <- read_excel("Streaming Services and Age.xlsx")
count(tvdata,AgeCat)
# A tibble: 3 × 2
AgeCat n
<chr> <int>
1 18–25 100
2 26–40 100
3 41+ 100count(tvdata,Platform)# A tibble: 5 × 2
Platform n
<chr> <int>
1 Amazon 54
2 Disney+ 61
3 Hulu 46
4 Netflix 111
5 Other 28contingtab <- table(tvdata$AgeCat, tvdata$Platform)
contingtab
        Amazon Disney+ Hulu Netflix Other
  18–25      4      22   23      47     4
  26–40     11      25   16      41     7
  41+       39      14    7      23    17
7.3 Visualization
stacked<- ggplot(tvdata, aes(x = AgeCat, fill = Platform)) +
  geom_bar(position = "fill") +
  labs(
    title = "Streaming Platform by Age Range",
    y = "Streaming Platform Proportion",
    x = "Age Range"
  ) +
  theme_fivethirtyeight()
stacked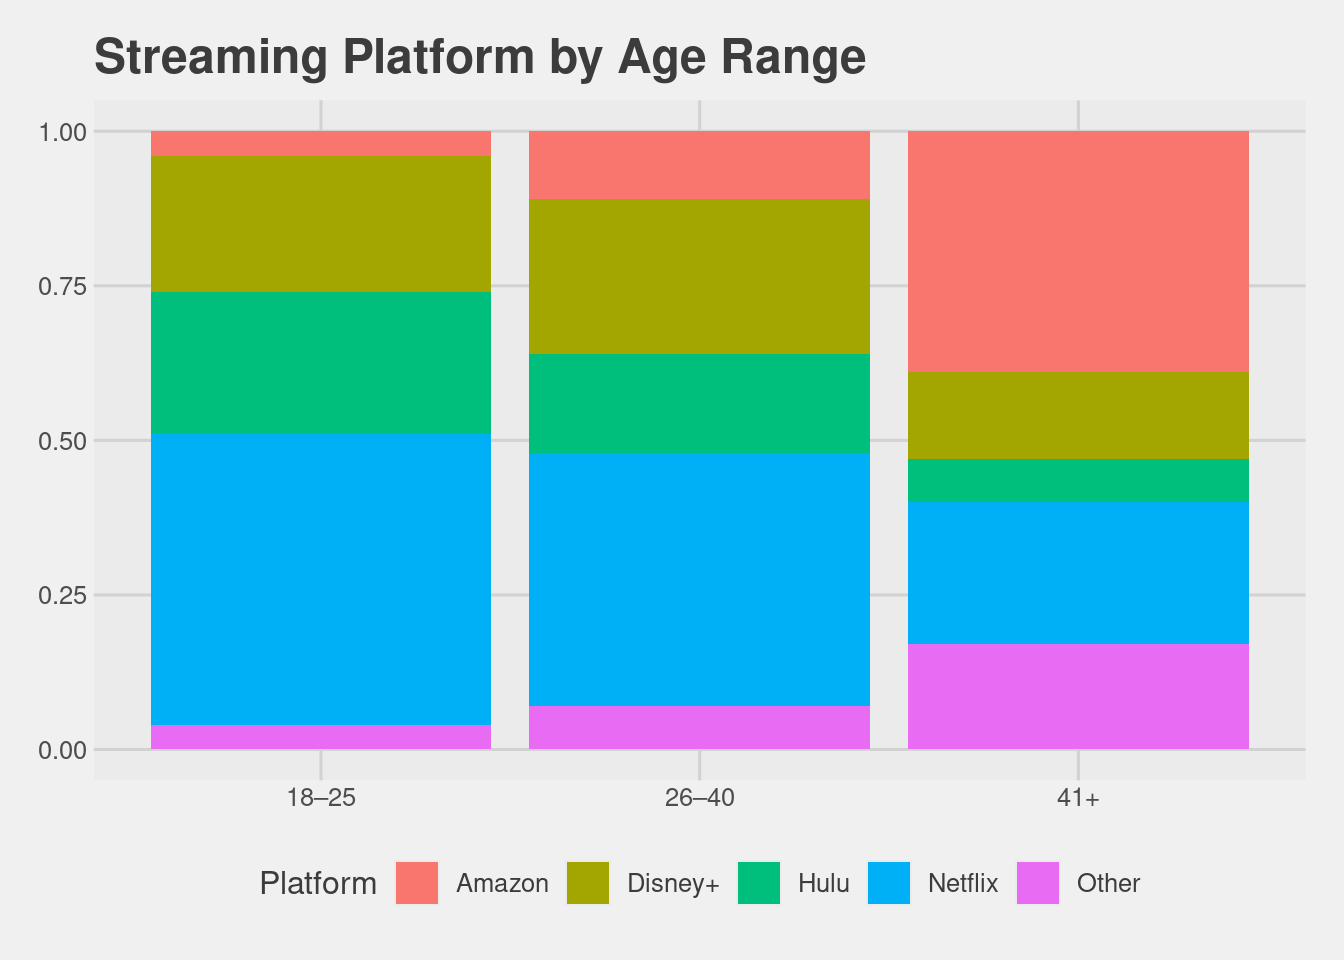
clustered <- ggplot(tvdata, aes(x = Platform, fill = AgeCat)) +
  geom_bar(position = "dodge") +
  labs(
    title = "Platform Preference by Age Range",
    x = "Streaming Platform",
    y = "Respondent Number",
    fill = "Age Range"
  ) +
  theme_economist()
clustered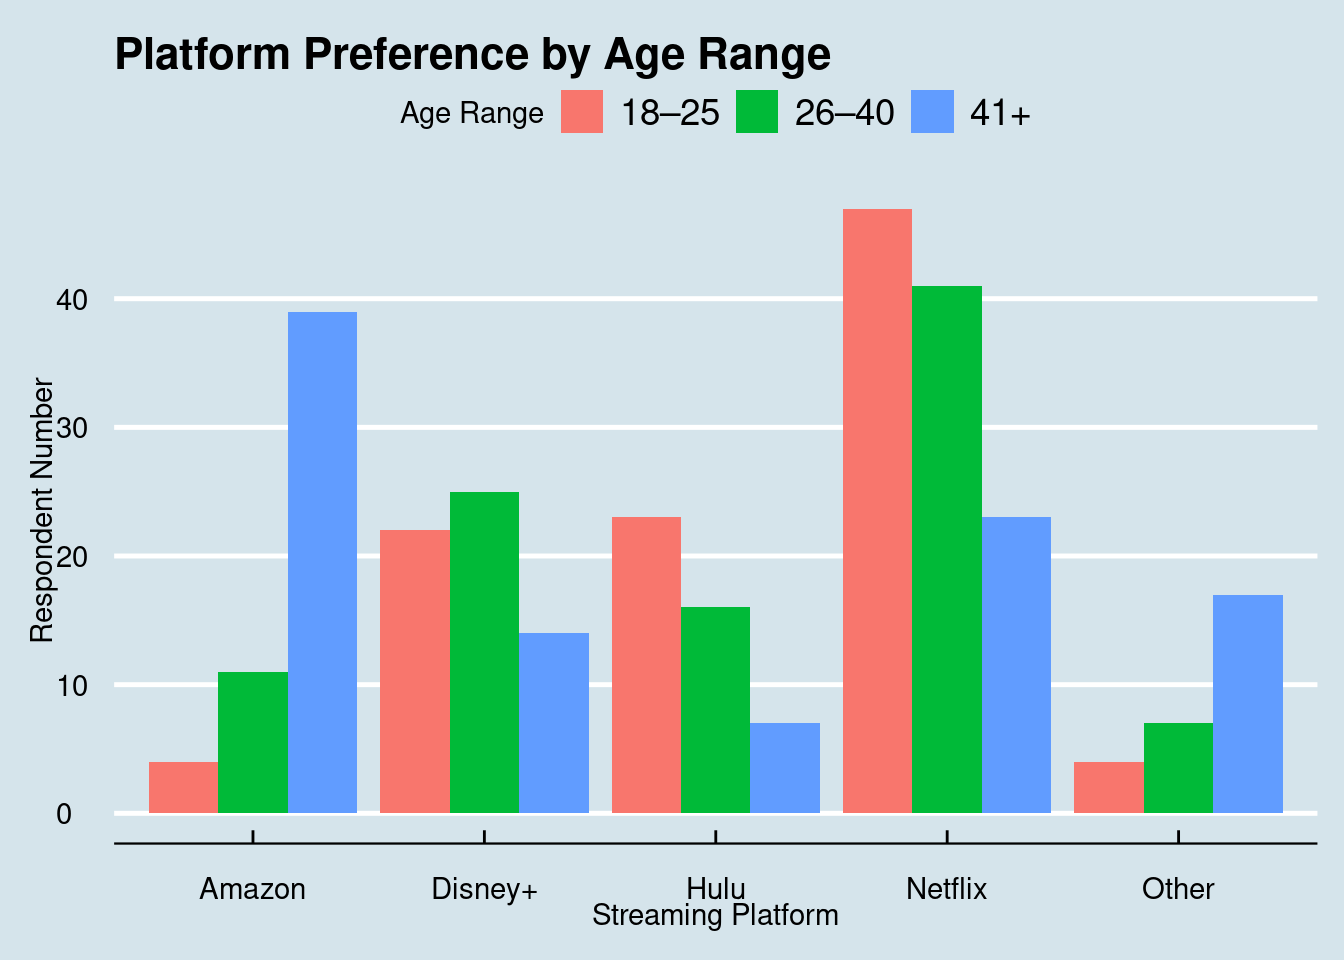
7.4 Chi-Square Test of Independence
chitest <- chisq.test(contingtab)
chitest
    Pearson's Chi-squared test

data:  contingtab
X-squared = 68.044, df = 8, p-value = 1.203e-11
A Chi-Square test of independence was conducted to examine the relationship between age range and streaming platform preference. The test produced a Chi-Square statistic of χ²(8,N=300) = 68.04, p <.001. Consequently, we can reject the null hypothesis. There is a statistically significant relationship between age range and streaming platform preference.
7.5 Observed, Expected, and Residual Values
observed <- chitest$observed
observed
        Amazon Disney+ Hulu Netflix Other
  18–25      4      22   23      47     4
  26–40     11      25   16      41     7
41+ 39 14 7 23 17expected <- chitest$expected
expected
        Amazon  Disney+     Hulu Netflix    Other
  18–25     18 20.33333 15.33333      37 9.333333
  26–40     18 20.33333 15.33333      37 9.333333
41+ 18 20.33333 15.33333 37 9.333333residuals <- chitest$residuals
residuals
            Amazon    Disney+       Hulu    Netflix      Other
  18–25 -3.2998316  0.3696106  1.9578900  1.6439899 -1.7457431
  26–40 -1.6499158  1.0349098  0.1702513  0.6575959 -0.7637626
  41+    4.9497475 -1.4045204 -2.1281413 -2.3015858  2.5095057
Note
I am using two standard deviations as the cutoff for “notable deviations.”
For 18 - 25 year olds, far fewer chose Amazon than expected. For 26 - 40 year olds, there were no particularly unusual deviations. For 41+ year olds, substantially more than expected chose Amazon and more than expected chose Other. Fewer than expected chose Hulu and Netflix.
7.6 Contributions to the Chi-Square Statistic
cellcontributions <- (observed - expected)^2 / expected
cellcontributions
             Amazon     Disney+        Hulu     Netflix       Other
  18–25 10.88888889  0.13661202  3.83333333  2.70270270  3.04761905
  26–40  2.72222222  1.07103825  0.02898551  0.43243243  0.58333333
  41+   24.50000000  1.97267760  4.52898551  5.29729730  6.29761905
chi_sq_total <- as.numeric(chitest$statistic)cellcontrib_pct <- 100 * cellcontributions / chi_sq_total
round(cellcontrib_pct, 1)
        Amazon Disney+ Hulu Netflix Other
  18–25   16.0     0.2  5.6     4.0   4.5
  26–40    4.0     1.6  0.0     0.6   0.9
41+ 36.0 2.9 6.7 7.8 9.3pheatmap(
cellcontrib_pct,
cluster_rows = FALSE,
cluster_cols = FALSE,
display_numbers = TRUE,
number_format = "%.1f",
main = "Contribution of Each Cell to Total Chi-Square (in Percent)"
)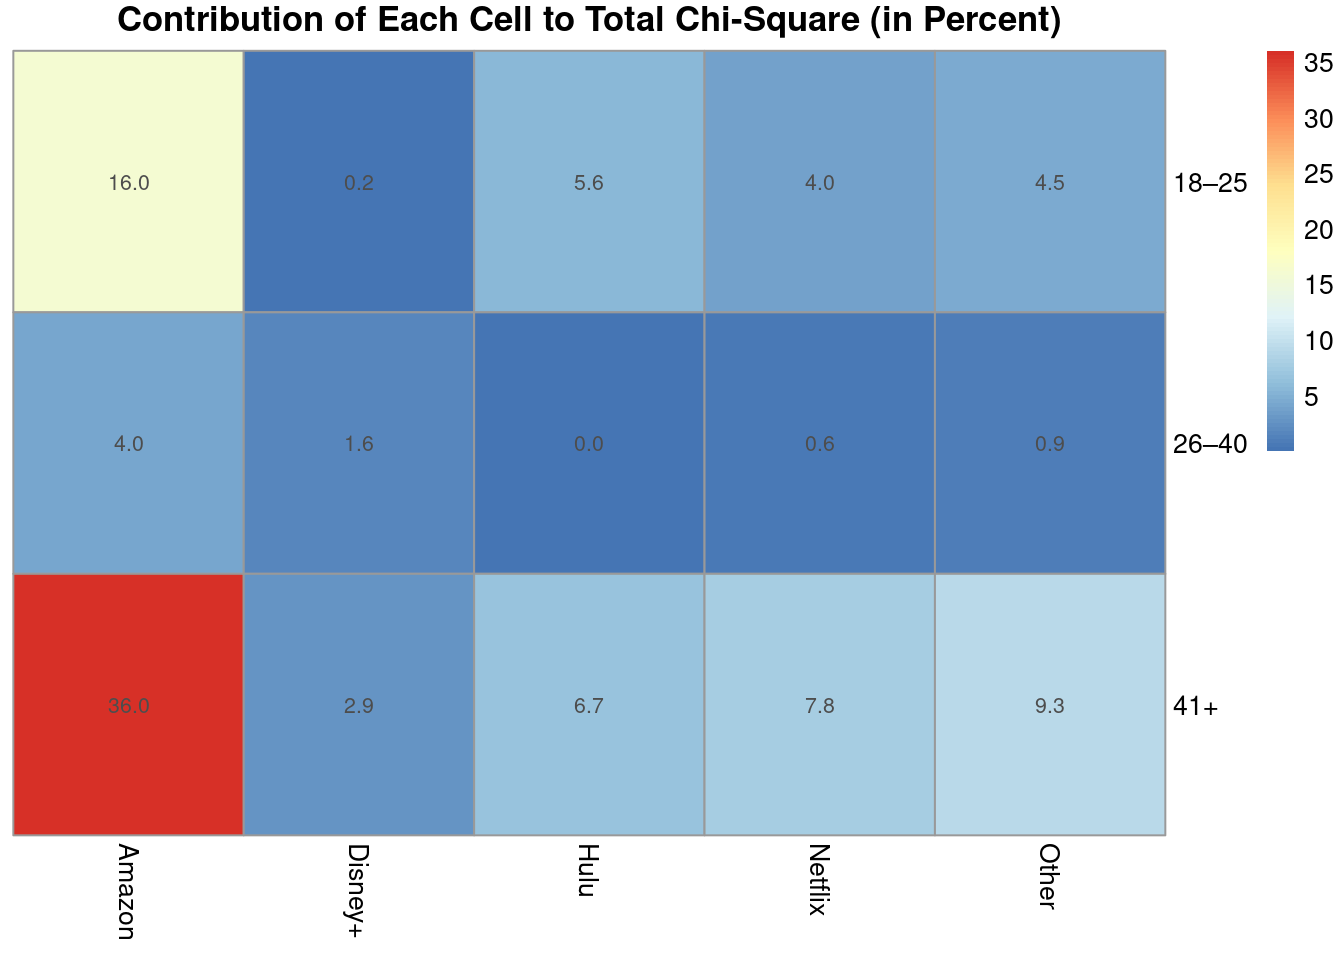
The cell that contributes the most is Amazon for 41+ year olds. This suggests that Amazon either has more content geared at adults than the other platforms, or that it enables access to a greater variety of adult-oriented subsidiary platforms (PBS Documentaries, Max, etc.) 41+ adults may also use Amazon more frequently since they are more likely to have Amazon Prime accounts already.
7.7 Effect Size (Cramer’s V)
n <- sum(contingtab)
chi_sq <- as.numeric(chitest$statistic)
r <- nrow(contingtab)
c <- ncol(contingtab)

cramers_v <- sqrt(chi_sq / (n * (min(r - 1, c - 1))))
cramers_v
[1] 0.3367584Cramer’s V = .34, indicating a moderate association between age and platform preference.
7.8 Final Interpretation
The Chi-Square test revealed a significant relationship between age and platform preference χ²(8, N=300) = 68.04, p <.001. The largest contributions came from the 41+ Amazon viewers and 18-25 Amazon viewers. 41+ viewers were far more likely to use Amazon for streaming than expected, while 18-25 viewers were far less likely to. 41+ year olds watching Other also accounted for a substantive amount of the association. Cramer’s V was .34 for the Chi-Square test, indicating a moderate association between age and streaming preference. It is likely that other factors (stylistic preference, cost, etc.) are also important.
In order to better understand the mechanisms behind these deviations, streaming services should conduct further survey research on user preferences. In particular, they should consider the subsidiary streaming services that Amazon prime viewers might be subscribing to through Amazon prime, as well as the exact services within the Other category. It is possible that there is a fair amount of overlap between subsidiary Amazon platforms and Other.